What are the rough suburbs of Melbourne?
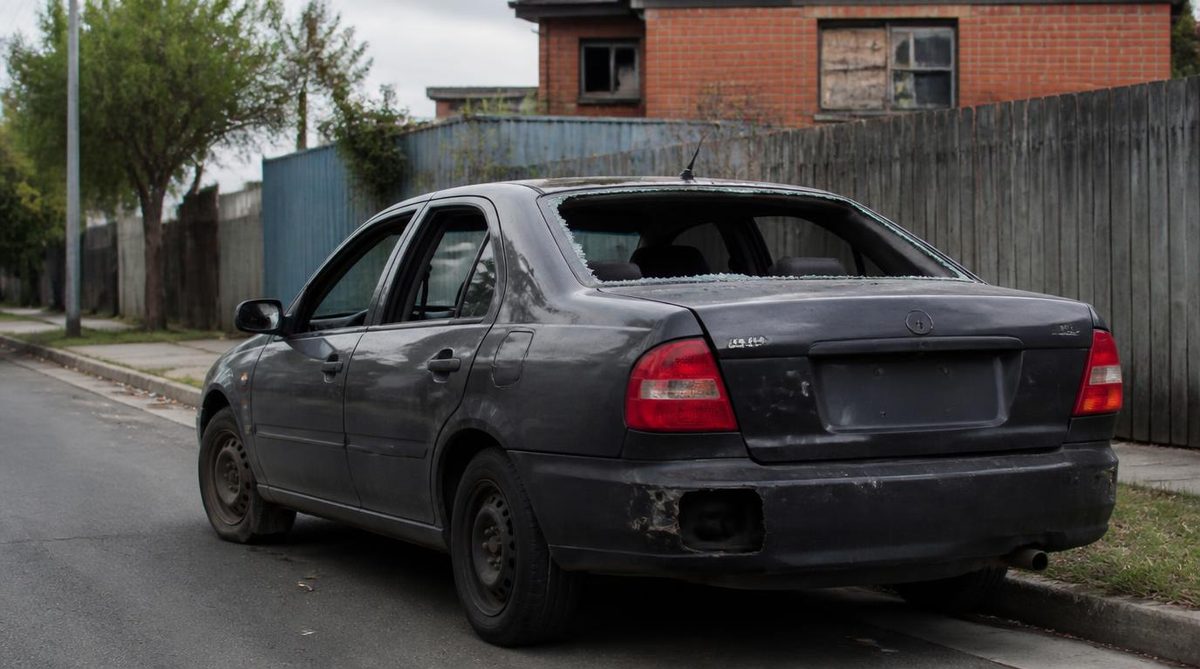
There is no official or reliable list of Melbourne's rough suburbs. Parts of Greater Dandenong, Frankston and St Albans often appear in informal discussions, as do some outer growth areas. Yet these broad labels hide large differences between streets, housing areas and local centres.
Central municipalities such as the City of Melbourne, Yarra and Port Phillip can also record considerable crime. They contain busy shops, major transport stops, nightlife areas and large visitor populations. That does not mean every residential street presents the same risk.
The useful question is what type of offence occurs, where it clusters, when it happens and how the rate was calculated. suburb cannot answer any of those points.
Why can't a Melbourne suburb be labelled rough or safe?
The word rough has no fixed meaning. One person may mean violence in public. Another may mean theft, poor lighting or loud behaviour near a station. A family may care most about the walk home from school. A shift worker may focus on the route from a train late at night.
There is no official category called a rough suburb. Crime statistics record offences within set geographic areas and reporting periods. They do not rate the character of a whole community.
A suburb can contain a busy shopping strip beside quiet residential streets. It can have an active station area and calm streets farther away. Newer estates may also differ from older parts of the same suburb because their roads, lighting and access points are different.
This is why reputations often fail as decision tools. A reputation may come from old news reports, a few visible problem sites or stories repeated long after local conditions changed. It may also reflect how an area looks rather than what current crime data show.
Greater Dandenong, Frankston and St Albans are sometimes named in discussions about crime and street disorder. That is a reason to inspect current evidence, not a reason to judge every resident or address within those areas. Each includes homes, services, workplaces and established community networks. Conditions still need to be assessed at neighbourhood level.
Before comparing suburbs, define the issue you care about. Is it personal safety while walking, theft from a car, problems near nightlife venues or home security? A broad crime total may give little help if it combines offences that have no clear link to your daily routine.
Why can the City of Melbourne, Yarra and Port Phillip look worse in crime statistics?
Raw incident counts and population based crime rates answer different questions. A raw count shows how many recorded incidents occurred in an area. A population rate compares incidents with the number of people who live there. Neither measure captures every person who enters the area during the day or night.
This matters in the City of Melbourne. Its shops, offices, venues, universities and transport hubs draw large numbers of people who are not counted as residents. Yarra and Port Phillip also contain busy commercial areas and nightlife precincts. Their daily population exposed to local conditions can be much larger than the population that sleeps there.
A resident based rate can therefore create a sharp result in a visitor heavy area. The number may be calculated correctly, yet readers can still draw the wrong meaning from it. It describes recorded incidents against the resident population. It does not measure the chance that one specific resident will be harmed on a quiet street.
Offence type also changes the picture. Theft around retail sites or transport areas may increase the total without showing uniform risk across nearby homes. Incidents linked to late night venues may cluster within a small area and narrow time window. A municipal total blends those settings with residential pockets several streets away.
The opposite error can occur in a large residential area. A lower total across the whole suburb can hide a small local cluster near one destination. A suburb average smooths out that cluster, even though it may affect the route a particular resident uses every day.
When reading crime statistics for central Melbourne, check four things:
- Whether the figure is a raw count or a population based rate
- Which offence category it covers
- The geographic boundary used
- The reporting period
- The time and setting of common incidents
- Whether visitors greatly outnumber local residents
This approach avoids treating a busy activity centre as if it were an ordinary residential suburb. It also stops a high theft count from being read as proof that every nearby home has the same safety problem.
What can recorded crime tell you about Greater Dandenong, Frankston and St Albans?
Recorded crime can show offence patterns, changes over time and local concentrations. It cannot turn a suburb into a single danger score.
Start by separating offences against people from property offences. A suburb with theft near a commercial centre presents a different practical issue from an area where incidents affect homes or people. Combining those categories removes the detail needed for a sound comparison.
Next, compare matching geographic units. Greater Dandenong is a municipality, while Frankston and St Albans may refer to suburbs in normal conversation. Comparing a council total with a suburb total is not a fair test. The areas cover different populations, destinations and land uses.
Counts and rates may also point in different directions. A large area can record more incidents because more people live there or pass through it. A smaller area can record fewer incidents but show a higher resident based rate. Neither result should be used alone.
Trends add another layer. One reporting period may be affected by a short cluster of events. Looking across several matching periods helps show whether an offence type is rising, falling or moving within its usual range. The date range must appear beside any claim because local conditions can change.
Police data also cover recorded incidents. Some events are never reported, while reporting habits can vary by offence. The data remain useful, but they measure what entered the recorded system rather than every event that occurred.
A fair comparison between named areas should follow the same method:
- Select the same offence category for each area.
- Use the same reporting dates.
- Match the geographic level, such as suburb against suburb.
- Read both the incident count and population based rate.
- Check several periods rather than one snapshot.
- Look for clusters near the exact address and usual travel route.
Suppose, as a hypothetical example, that two suburbs record similar total crime. One has theft concentrated near a large shopping area. The other has incidents spread through residential streets. The totals look alike, but the address level meaning is different. The location and offence mix reveal what the total hides.
This method is more useful than a ranked list. Rankings often combine unlike places, mix offence categories or rely on data from different dates. They produce a simple headline at the cost of a clear answer.
Why do the street, station and time of day matter more than the suburb name?
Crime and visible disorder can gather around places that attract movement. Railway stations, shopping strips, nightlife precincts and major car parks can create conditions that differ from nearby residential streets. Parks and walking routes can also feel different after local activity drops at night.
A suburb average cannot describe these micro-locations. It cannot tell you whether the path from a home to public transport is well lit. It does not show whether nearby shops keep the street active in the evening or close early. It may also miss how an underpass, vacant frontage or isolated parking area affects a regular trip.
Time changes the experience of the same place. A station approach can be busy during the weekday commute and nearly empty late at night. A dining area may feel calm in the morning but crowded after venues close. A quiet street can feel comfortable to one person during daylight and exposed to another person returning from work after dark.
These observations do not prove that an offence will occur. They show how the design and use of a place affect a person's exposure. Two homes in the same suburb can support very different routines if one is beside a busy centre and the other is reached through active, well lit streets.
Visit the exact address at the times you expect to use it. Walk from the home to the station or bus stop. Check the path to shops, parking and any place household members will visit often. Do the trip during a normal weekday and return after dark if late travel will be part of your routine.
Look for working lights, clear sightlines, active frontages and other people using the route. Notice isolated sections and places where the path narrows. Listen for noise that may affect the home even when it has no link to crime. Personal comfort and recorded crime are different measures, but both matter when choosing where to live.
How should you check a Melbourne neighbourhood before moving?
Compare exact addresses under the same rules. Do not compare one suburb's reputation with another suburb's current statistics.
Check current official crime data
Use Victorian crime statistics for the latest available reporting period. Search at the smallest useful geographic level. Read the notes explaining boundaries, offence groups and rate calculations before comparing results.
Separate the offences that affect your routine
Choose categories linked to your real concern. A person who parks on the street may focus on vehicle related property crime. Someone who walks home late may care more about incidents affecting people in public places. Keep each category separate.
Review more than one reporting period
A single period can exaggerate a short cluster or hide a change that has started recently. Use matching periods for every address. Record both counts and rates so that differences in population do not disappear.
Inspect each route in person
Visit more than once. Test the walk to public transport, local shops and parking. Check daytime conditions and conditions after dark. If children or older family members will use a route, assess it from their point of view as well.
Ask local questions without treating stories as proof
Neighbours, nearby workers and local services may identify recurring noise or a poorly lit route. Their comments can guide what you inspect. One story cannot establish a crime trend, so compare it with official data and your own visits.
Use one comparison sheet
Score each exact address against the same practical points:
- Current offence types within the relevant area
- Changes across matching reporting periods
- Distance from local incident clusters
- Lighting and visibility on regular routes
- Public activity at the times you travel
- Noise and street conditions after dark
- Access to transport without isolated sections
- How comfortable each household member feels there
A low overall crime rate cannot promise that every street or journey will feel safe. A suburb with a poor reputation can still contain calm residential pockets that suit a person's routine. Current data and an on-site inspection answer different parts of the same decision.
Compare two or more exact addresses with matching official crime data, then walk each regular route at the time you will use it.